Nicolson-Ross-Weir Material Parameter Extraction
Measuring a material's permittivity and permeability from waveguide S-parameters, in a short MATLAB script.
Details
| Type | Personal / research tool |
|---|---|
| When | 2026 |
| Language | MATLAB |
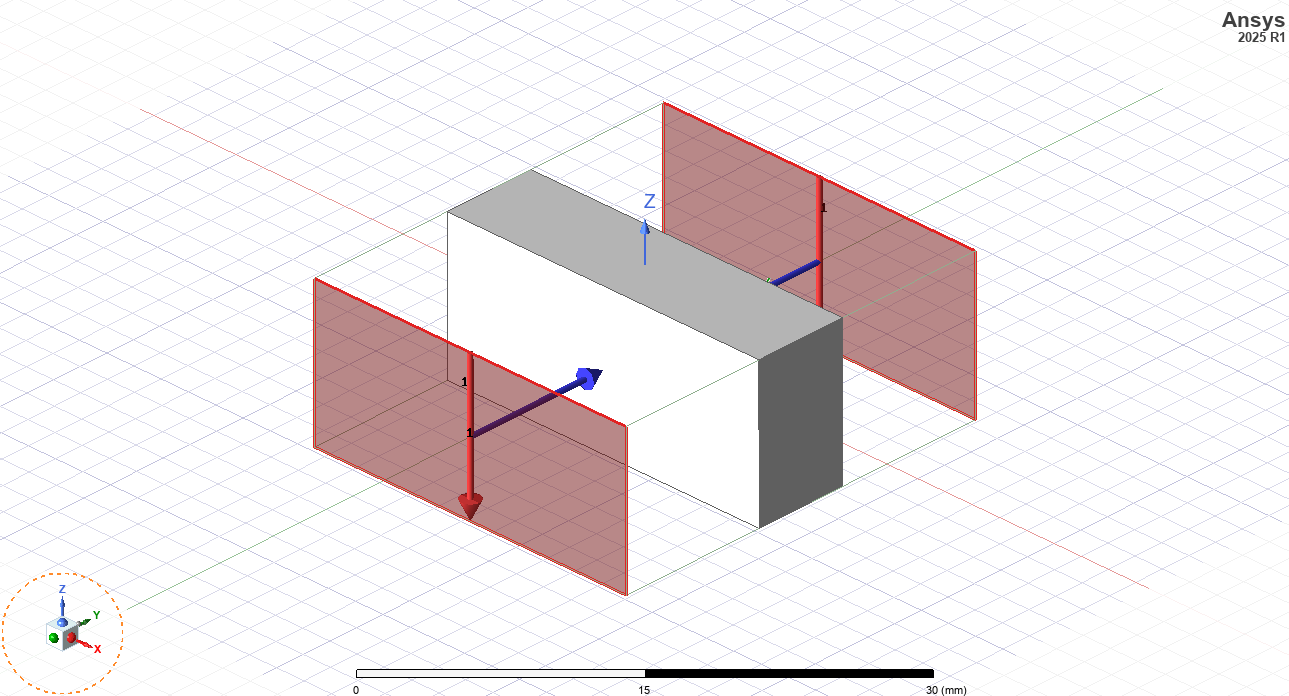
| Test case | 6.3 mm PTFE (Teflon) sample in WR-90 waveguide, 8–12 GHz (HFSS simulation) |
| License | MIT |
| Code | git.natetheokay.com/nathan/Nicolson-Ross-Weir-… |
What it is
A simple MATLAB script to extract the effective permittivity and permeability of a material from its S-parameters measured in a rectangular waveguide. The method used is the Nicolson-Ross-Weir method.
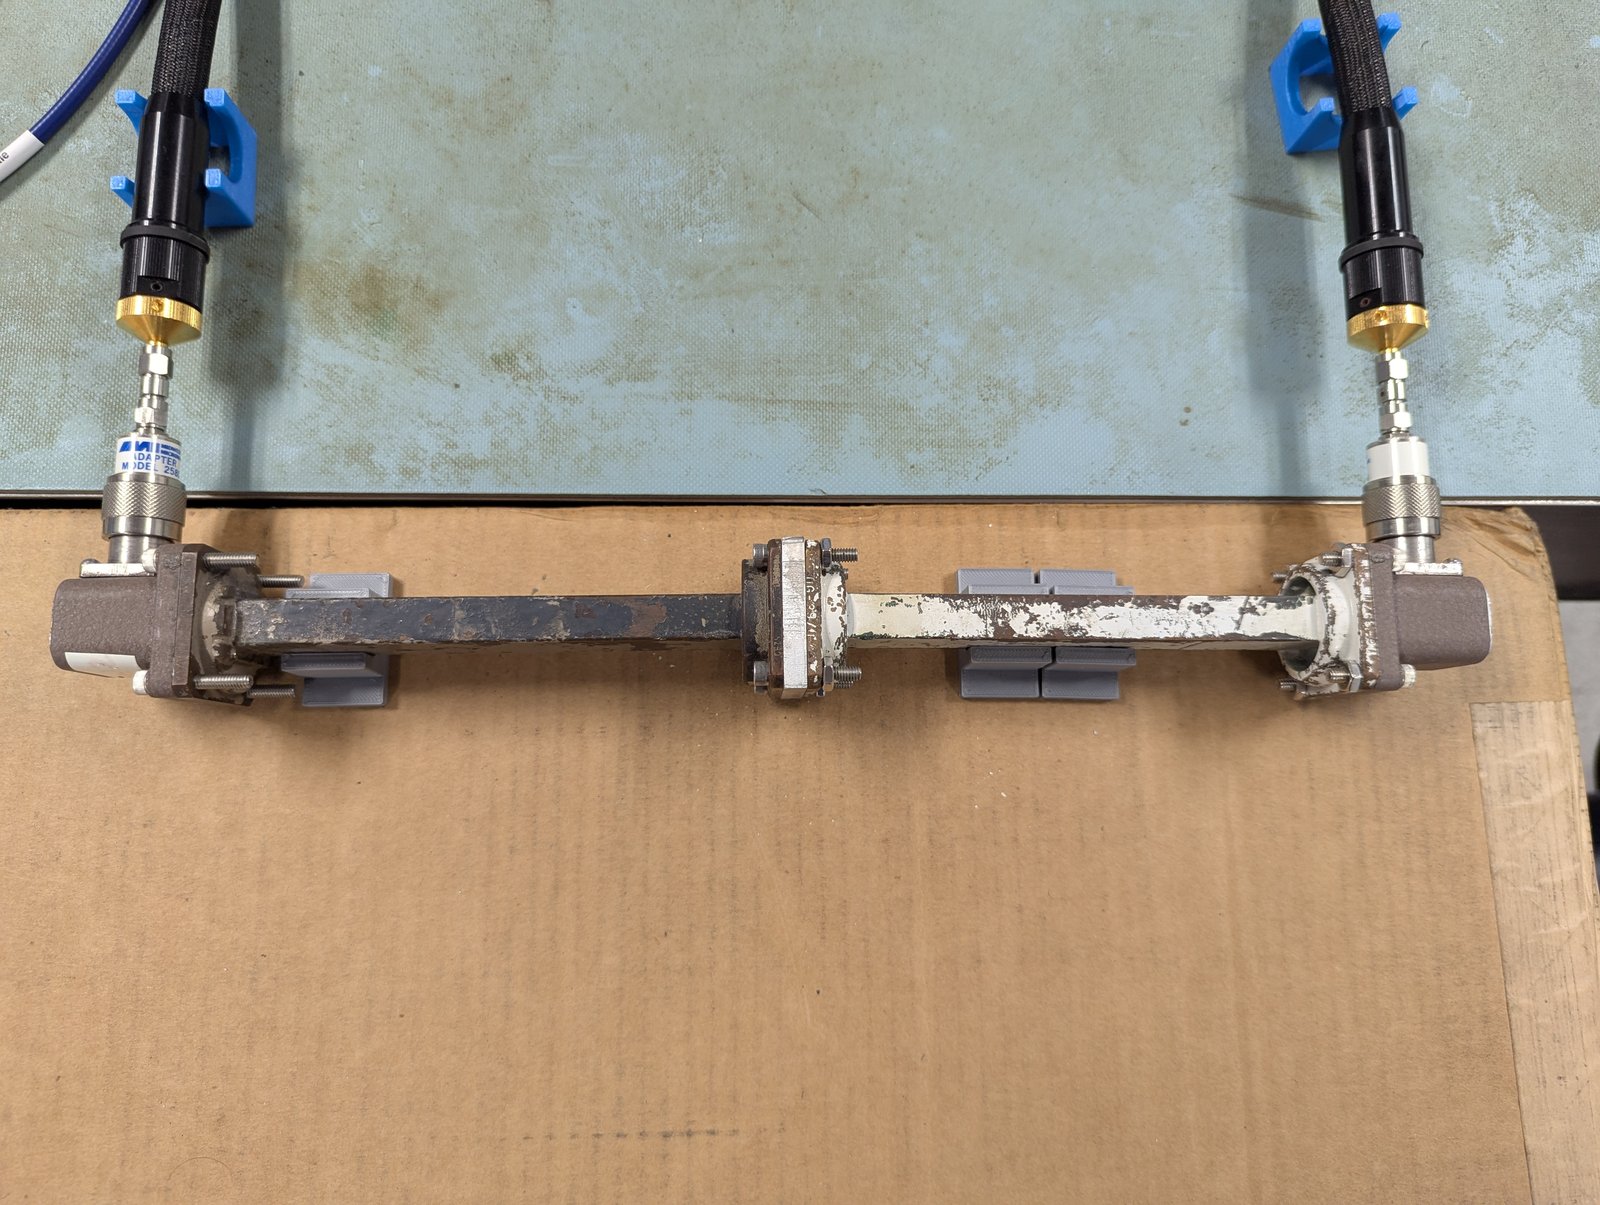
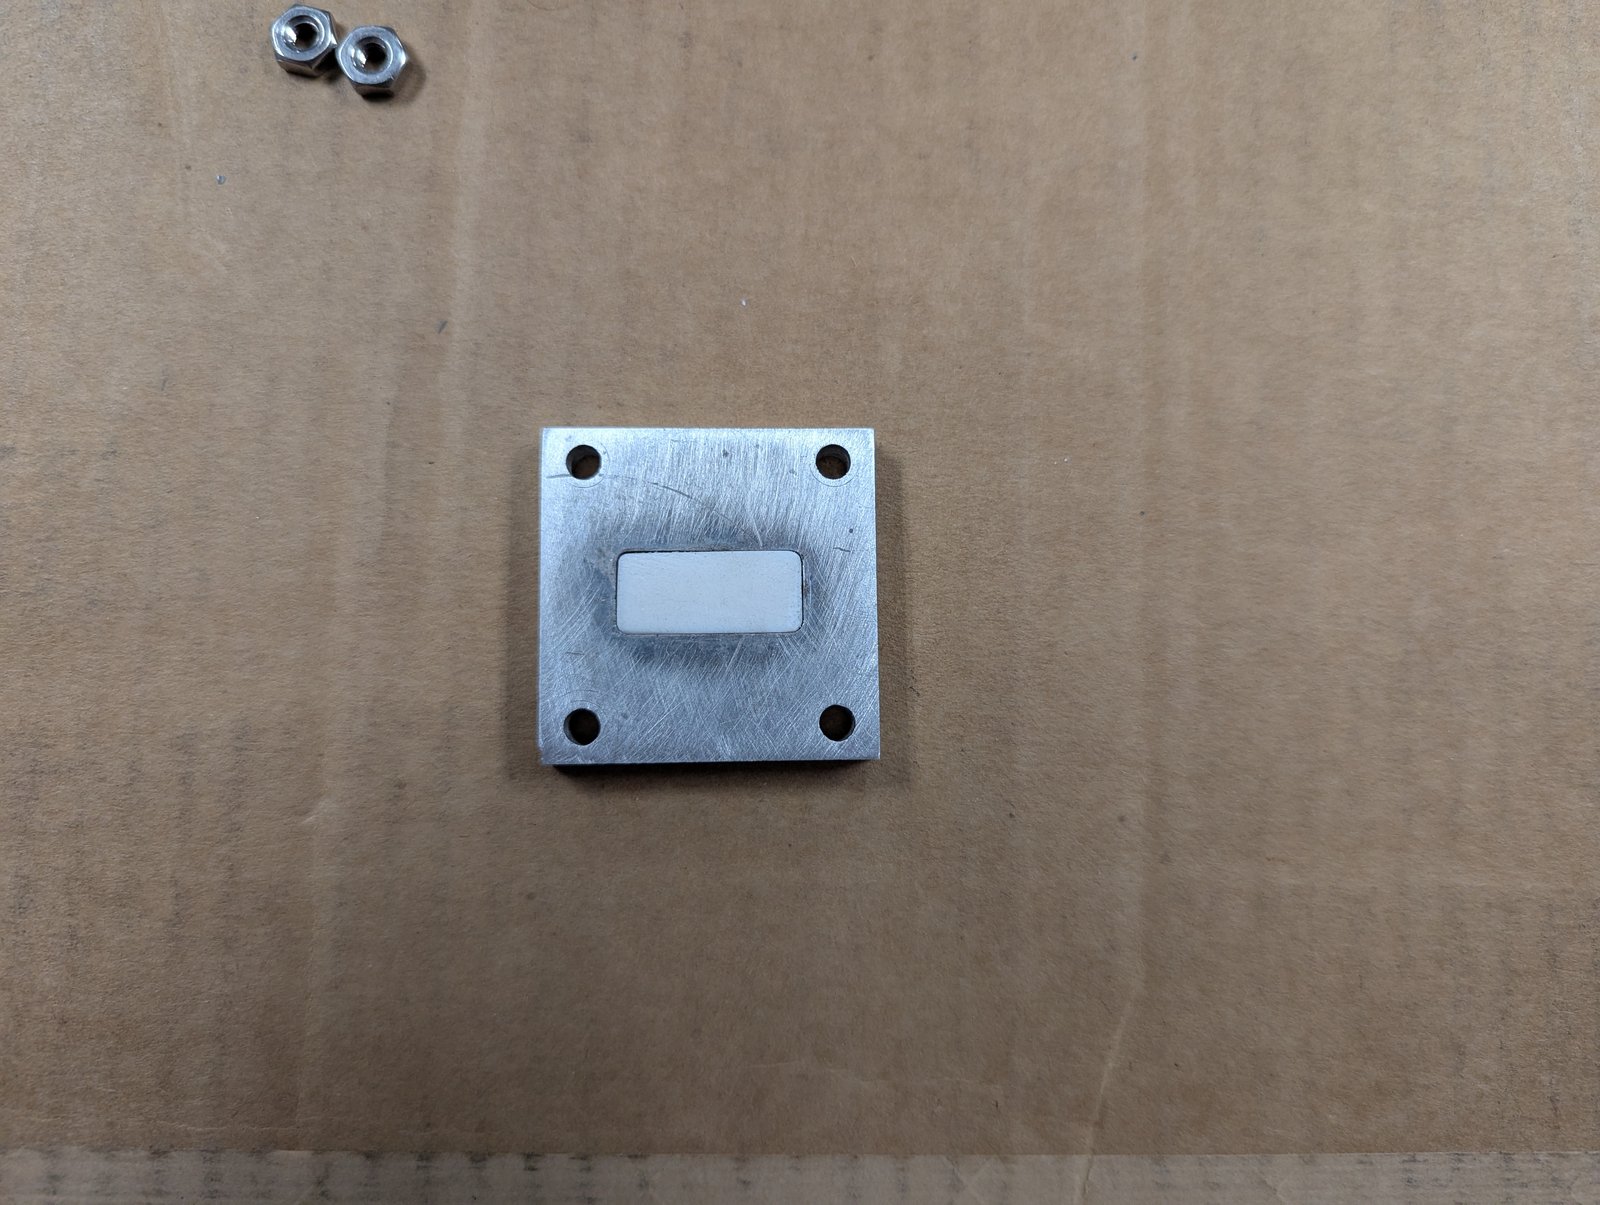
How it works
A sample of known thickness fills the cross-section of a rectangular waveguide. From the measured (or simulated) two-port S-parameters, the Nicolson-Ross-Weir equations recover the reflection coefficient at the sample face and the transmission through it, and from those the complex relative permittivity (εr) and permeability (μr) across the band. The implementation follows NIST Technical Note 1536 (p. 112).
Results
The repository includes a reference case: a 6.3 mm block of PTFE simulated in WR-90 waveguide. The extraction should return values close to Teflon's known properties (ε′ ≈ 2.1).
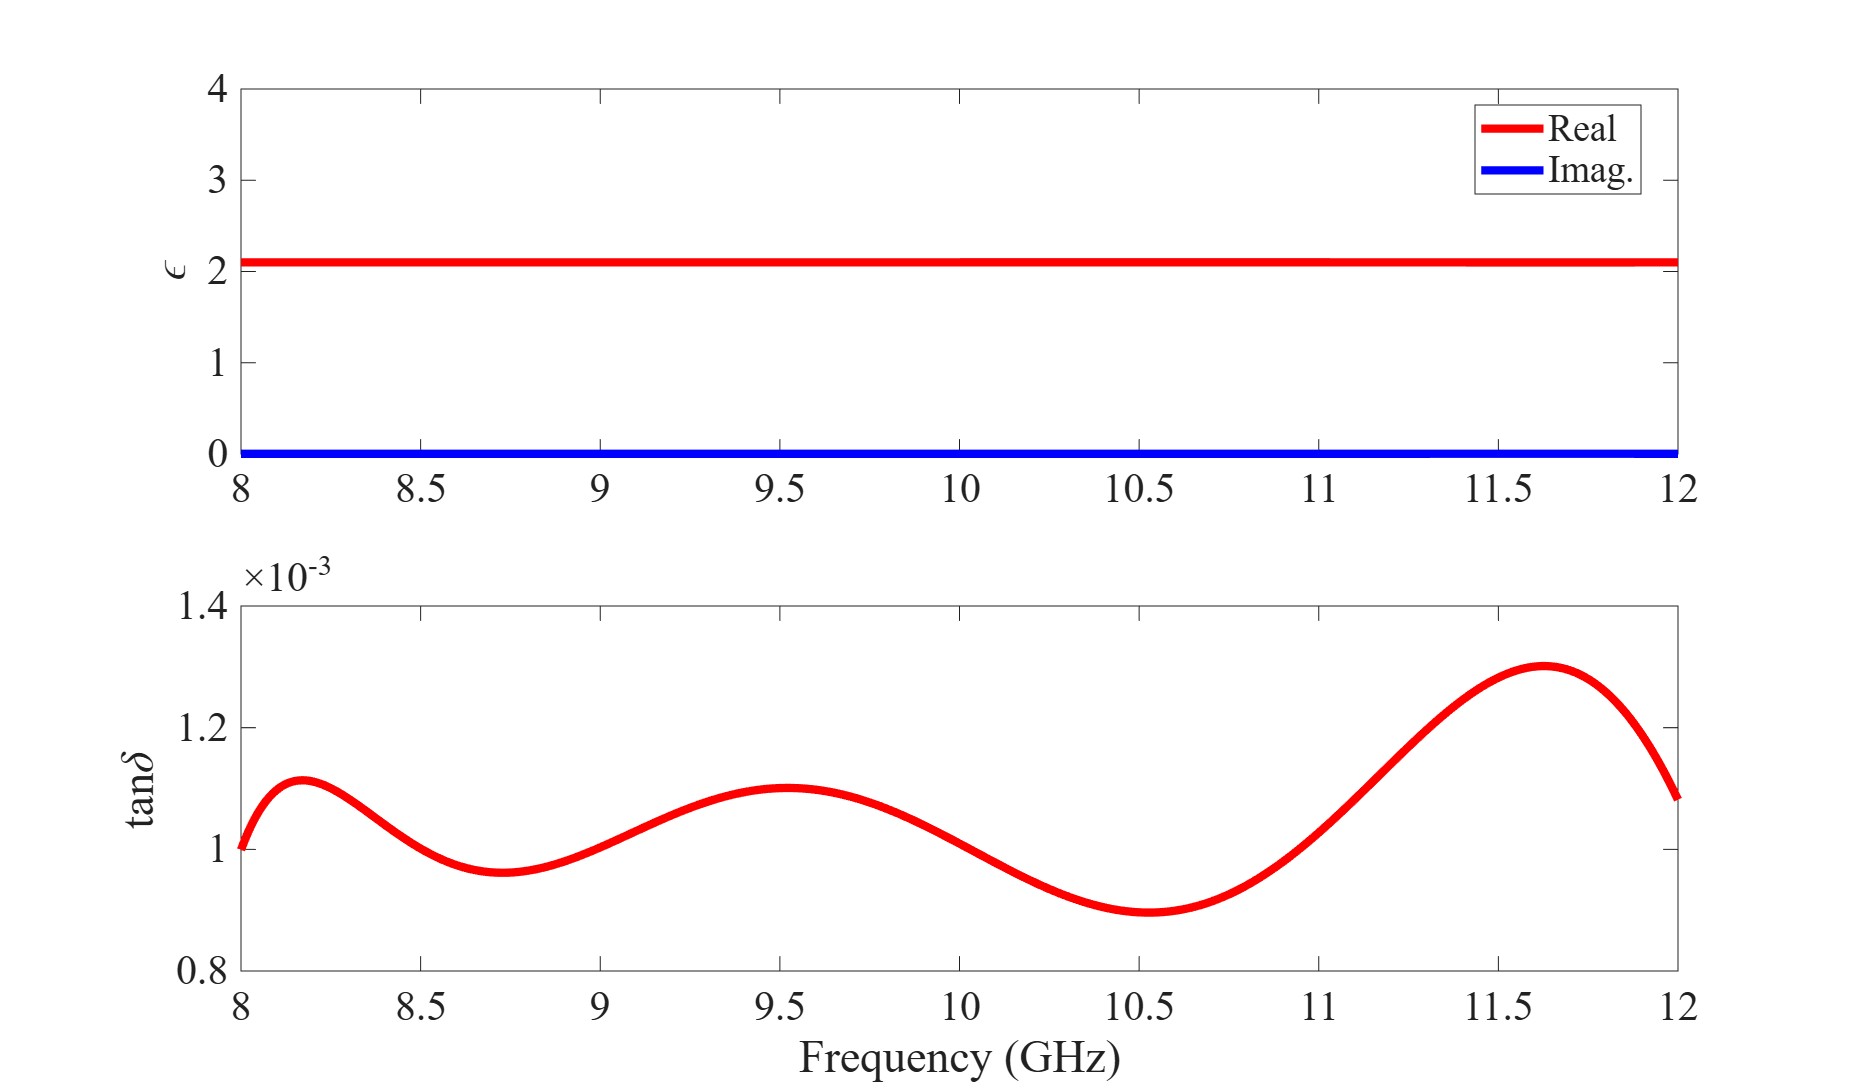
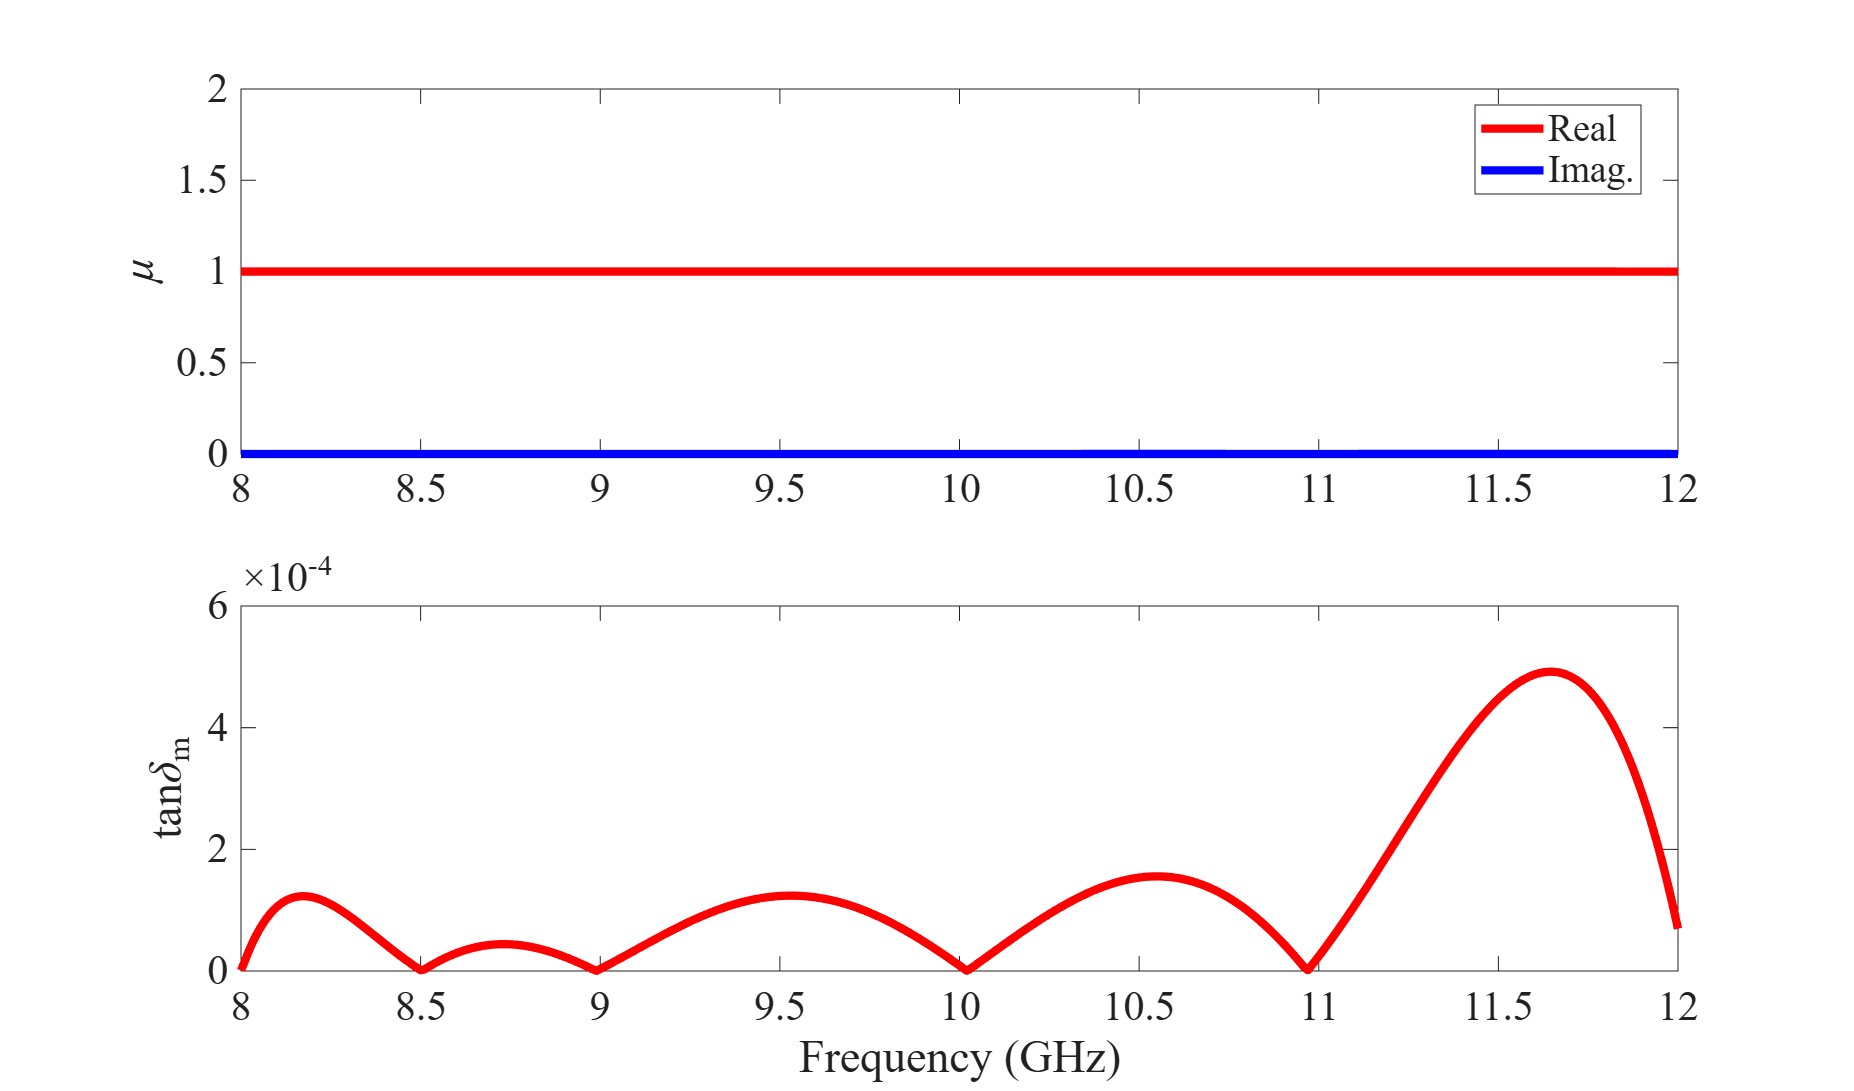
Example output for the Teflon test case:
Averages:
er = 2.1000
tanD = 0.0010584
ur = 0.99962
magtanD = 8.2202e-05
At 10 GHz
er = 2.1000
tanD = 0.0010094
ur = 0.99962
magtanD = 8.9186e-06
Practical notes
- Measure the sample thickness carefully. An error in the thickness goes straight into both ε and μ across the whole band. Use a micrometer or calibrated caliper and average several readings.
- Pick the sample length. Aim for about a quarter of the guided wavelength in the material. High-permittivity materials need thinner samples to avoid phase-ambiguity errors.
- Don't renormalize simulated S-parameters. When exporting from HFSS, keep the S-parameters normalized to the waveguide impedance, not 50 Ω.
- I initially wrote this code to extract the effective permittivity of 3D printed samples with different infill values. With a period small enough compared to wavelength, the gyroid infill pattern makes a nice effectively isotropic material that can emulate an arbitrary permittivity less than that of the bulk material.
References
- A. M. Nicolson and G. F. Ross, “Measurement of the intrinsic properties of materials by time-domain techniques,” IEEE Transactions on Instrumentation and Measurement, 1970.
- W. B. Weir, “Automatic measurement of complex dielectric constant and permeability at microwave frequencies,” Proceedings of the IEEE, 1974.
- M. D. Janezic and J. A. Jargon, Complex Permittivity Determination from Propagation Constant Measurements, NIST Technical Note 1536, 2004.